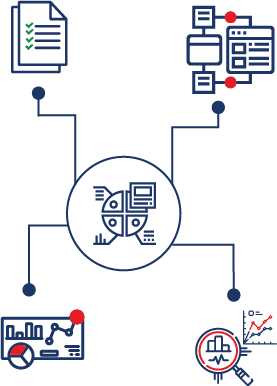
Data Visualization

Bring your data to life with stunning data visualization services that will revolutionize the way your customers experience your business.

Grab Our Authentic Data Visualization Service


The data that corporations face across the globe is increasing, posing the challenge of analyzing it to make more informed business decisions. Initially, for that reason, data visualization techniques highlight the clearness, succinctness, coherence, and articulation of visual images to make data more meaningfully displayed. Also, the most common type of data display is grandiose visuals, illogical diagrams, and levels. Besides these often result in ineffective outcomes that are not serving their original purposes.


Although, at Eicra.com, we provide professional data visualization services that are tailored to the aesthetics and goals of data analytics. In fact, we use top-of-the-line data display software to present a large amount of information to you or your clients in an easy to comprehend format. So that, this is also due to our extensive expertise dealing with multinational corporations.

Moreover, Eicra.com’s expertise in managing critical components of data analytics stems from our understanding of how important Information may be presented in an efficient manner. On the other hand, you can outsource data visualization services to us for a variety of reasons. Also, it includes ranging from color selection to determining the best techniques for your needs.

data visualization services
visualization data consulting

Additionally, app novation cooperative methodology identifies your business needs before building a customized solution with recommendations for the best technology stack.

Data experienced and result driven

So, our goal is to help brands understand how digital can play a role in actualizing strategies. Also we can solve the real-world business problems with a constant focus on the customer experience and results.

8 Quality Full Data Visualization Services For You

We work for a variety of industries. So that, the team has the skills and experience in managing Data Visualization projects that back up the passion it has for the work.

2. Visualization of Text Mining

The process of analyzing, exploring, and mining patterns and insights in unstructured text data.

3. Applied Econometrics

Quantitative evaluation of economic relationships and different economic theories using a variety of statistical methods.

4. Latest Forecasts Methods

It is a method of predicting the future by using data from the present and past.

1. Data Series Visualization

A Visualization technique used to analyze and identify patterns and relationships from data points taken over Series Visualization

Data Series Visualization

Visualisation of text mining

A Course in Applied Econometrics

Forecasts

Advances in Econometrics

Modeling Predictive

Client Segmentation & Profiling

Advisory System

5. Advances in Econometrics

A quantitative approach to the analysis of economic relationships & testing different economic theories using statistical methods.

8. Modeling Predictive

The use of machine learning techniques and statistical methods to predict future outcomes and events.

7. Segmentation & Profiling

An approach or technique for segmenting a large customer base into similar customer groups.

6. Top Advisory System

The algorithms and techniques are used to identify patterns. present and past.

With Data Visualization Services Take The Lead

To achieve your business goals, give your data a voice. So that, it can pay homage to your brand. Initially, we represent specialize in turning data into compelling narratives.


On the other hand, conversions are higher and brand discussions are more memorable when infographics, interactive websites, and conversational interfaces are used.


Although we’ve helped thousands of businesses, small and large, improve customer experience and architect their digital transformation by leveraging analytics in other countries. So that, we can give you the best help desk services.


Moreover, innovation is a digital consultancy that offers full-service solutions all around the world. On the other hand, our firm provides clients with human-centered business solutions. Through a strong combination of technology and flexibility, we can also create strategies and insight that inspire potential. So, contact us today to discuss how we can work together to revolutionize your industry.


On the contrary, we can help you with data visualization. So that, thousands of businesses all around the world have utilized our interactive services to gain insight into their business outcomes by determining what is most likely to affect them. Also, you can explore the info and its math behind the findings by knowing how we visualize and present it to you. On the other hand, it is allowing you to make confident business decisions.

Advanced Data Display Solutions

Consultation

Furthermore, our company assists businesses in becoming data-driven. In brief, throughout the process, we help clients uncover and execute the advantages of smarter businesses.

Strategic Approach

Although we provide data science and visualization services that assist companies in achieving their goals. Also, creating effective strategies one of the objective. So that, we are the best in this services.

Mentoring

However, we develop analytical proficiency, and we also embed data culture within our organization by educating and empowering all levels. Moreover, analytical proficiency can assist your business grow.

How Our Services Work For You?

Utilize Big Data Visualization Techniques to transform your data into intelligent insights.

So that, it is our mission to help organizations become data-driven enterprises by integrating data science & analytics into their culture and strategy. Importantly, it is our goal to empower organizations at all levels with information. After all, it can improve their analytical literacy and awareness. We also work for

Database Development & Dashboards.

Optimizing Data Visualization.

Consulting on Business Intelligence & Data Analytics.

Design & Creation of Custom Visualizations.

How Our Data Visualization Services Work For You
1. The Training & Seminars
 

You’ll also discover how to increase your company’s data competence and awareness.

2. Data Management

Since the processing of data, the transformation, the design of databases, Data Management, the mapping of data.

3. Business Intelligence
 

Finally, the data-culture is ingrained in the company at all levels by educating and empowering the whole organization.

Frequently Asked Questions

Are data visualization and information visualization same things?

However, both are connected, but they are not the same concept. Also, data perception is linked to highlighting information that is important to your business. As a result, data designs can be used as examples of data interpretation. On the other hand, information perception is more likely to display primitive data graphically.

Why is data visualization important?

Data research in large informational indexes is difficult, and you can’t expect everyone to understand it as well as information auditors do. However, the most basic approach of communicating examination results to anyone is through information representation. So that, by simply visualizing data, you can speed up your business.

Why do we use data visualization/What is the main reason for using data visualization?

Large data set with thousands or millions of information focuses are practically difficult to perceive usable data or also reach inferences from except if some sort of perception is utilized. Regardless of whether it’s a fundamental chart or an intelligent information representation dashboard.

What are data visualization techniques?

Therefore, data visualization techniques incorporate outlines (line, bar, or pie), plots (air pocket or dissipate), charts, maps (heat maps, geographic guides, and so forth), and lattices. Although, there are many minor departure from these particular procedures that originators can use to meet explicit representation needs dependent on the information they’re working with.

Which tools you use in the data visualization process?

After all, tools are primarily decided as per requirement. So that, the major tools that we use are:

  1. Looker
  2. Tableau
  3. Zoho Analytics
  4. Sisense
  5. Qlik Sense
  6. Microsoft Power BI

Get Touch With Us To Take Our Services

error: Alert: Content is protected !!